Author: Graham Mannix – Director Convergenius Pty Ltd
Over the years I have tried to improve how I report to management and developed what I call ‘Project on a page’. If you can’t fit it on a page then don’t bother! Why you may ask? There are a number of reasons why I set out to simplify the management reporting process.
I don’t know about you, but in my years of experience in the engineering and construction industry, I have found that practical, visual things are easier to understand. I was always hard pressed to read over pages with numbers and narrative and decipher information from it.
Not to mention the time it takes when there are far more important tasks that require completing. More often than not management is not really interested in the detail, the nuts and bolts of it all, they just want to know what was achieved today, this week, this month and what, if anything, is holding us up – are we on time and on budget? So many of the management reports that I have seen are filled with so much detail that while they may answer all the questions, the possibility that a Manager can comprehend them at a glance is fanciful.
I developed some basic parameters of importance for instance:
- Work area/Location
- Tasks Split into Disciplines wherever possible
- Show Effort / time for each area
- Show sequence of the Works
- Show percentage of project represented by each area
- Status identified by Traffic Light colour scheme Red = work to be done. Amber = we are working on it . Green = completed.
- Percentage completed …….. This is the element where I have seen most errors occur and it is prone to guesswork and/or exaggeration. So to remedy this my solution is just make the areas small enough such as 3% to 5% (this is not always achievable) of the project then this removes the error tendency. To be extra conservative I would not report a percent complete until an area goes Green.
These parameters are a guide only and project constraints often dictate other approaches but the principles remain the same.
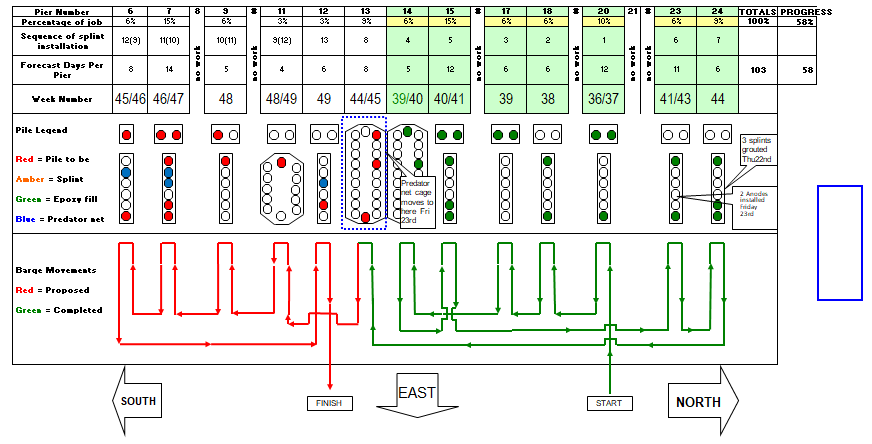
Below as an example of a Bridge Pile Repair Project where you can see all the parameters in action.

You will notice the diagram does not outline activities in detail, just work areas and their status of red, amber or green. It does however show the dive barge predator net actual and planned movements, which dictate the work sequence. You will see that the diagram is split into areas of work with various information as previously noted. The main overall project status indicators are the 2 boxes in the top right of the diagram that each show 56% complete. On this particular project the workforce was static with no increases or decreases so these 2 figures were always the same. There was another factor that the diagram does not show, that of the cashflow on the project which had high establishment costs. This meant money was flowing out early in the project with no corresponding percentage complete movement on any of the project areas in terms of physical work. This needs to be closely monitored because normally it takes quite some time for the physical work to claw back the imbalance until it reaches that Breakeven Point where physical work progress is slightly ahead of cashflow.
Lastly, a benefit that I did not foresee was the snapshots represented by saving each progress mark-up so at the end or at any point in the project they provided almost an animation of progress.
So if you or your people comprehend visual concepts more easily, or you are looking for a simpler way to report on projects to management, then give the ‘Project on a Page’ concept a try and see where it takes you.
One final note…. Don’t get too complicated because diagrams can become too busy for the reader to comprehend so you will have lost any anticipated gains. Just stick to the main issues.
With rsured™ we have adopted the same principles of ‘Project on Page’ where you are able to report on key business indicators, so managers can easily see where they need to focus their attention.
